Frequently Asked Questions
www.qantrading.com, simply branded as 'QUANTRADING,' is a website that offers quantitative analytics for active traders with a short-term horizon (ranging from 1 day to 5 weeks).
The QUANTCHARTS are a quantitative analysis tool that integrates traditional candlestick charts with advanced quantitative data, providing traders with insights to anticipate the potential end/reversal of short-term (DAILY and WEEKLY) trends.
The QUANTCHARTS address two key questions for the displayed market:
- how far can the current trend extend within a given number of days or weeks?
- what is the probability of the current trend reversing at specific price levels, if reached within a given number of days or weeks?
Note the emphasis on predicting how far a trend can extend and the probability of trend reversals within a given number of days or weeks: QUANTCHARTS help traders identify price targets (Strikes) that have a low probability of being reached by a certain date (or with a high probability of seeing a trend reversal before/upon being reached).
This information can be used to sell successfully options premiums at strikes with a low chance of being reached by their DAILY or WEEKLY expiry date.
Alternatively, it can be used to trade high-probability trend reversals, such as placing a directional LONG trade when the market is falling (or a SHORT trade when the market is rising).
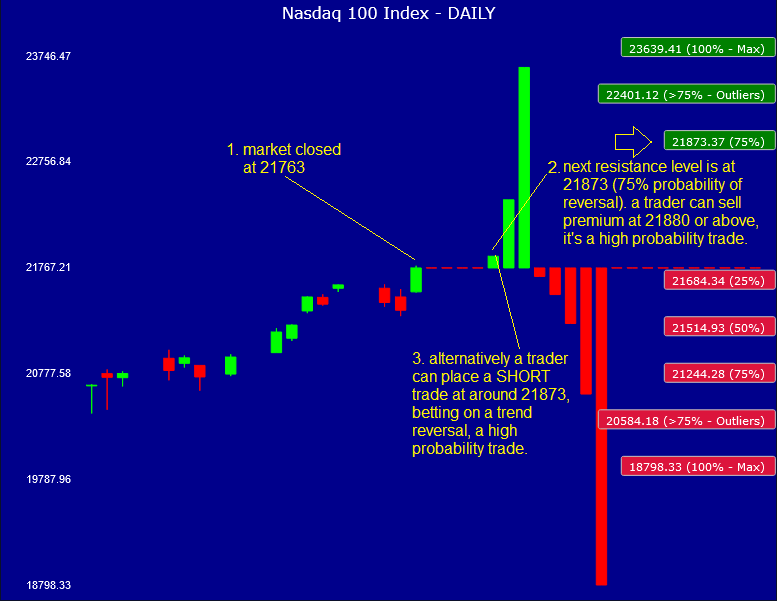
For a practical example of how to use the insights provided by QUANTCHARTS, click the chart below to expand it and review the detailed annotations (check also the other FAQs for more usage examples).
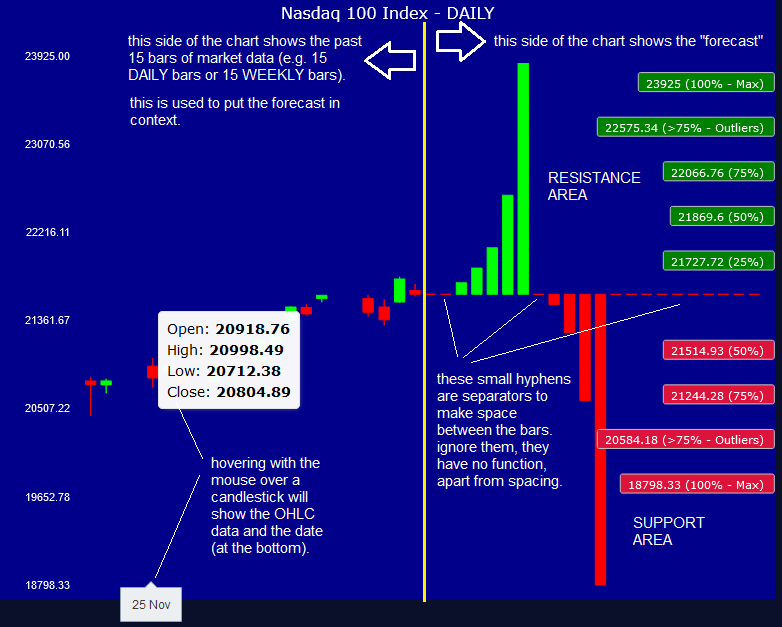
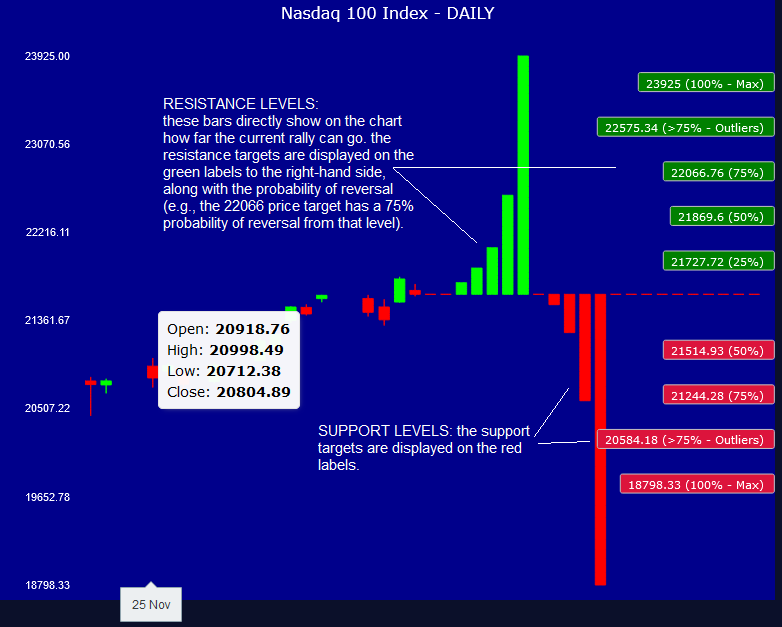
Please refer to the images below to learn how to interpret the information displayed on the QUANTCHARTS. Click on the images to expand them for better readability.
Technical Analysis Charts rely on indicators and visual chart patterns, methods with limited predictive power that are heavily dependent on the chartist's interpretation. This adds significant variability to the forecasts, as human judgment often introduces noise into the analysis.
In contrast, QUANTCHARTS use mathematical formulas to identify price and time patterns that have consistently appeared throughout market history and continue to do so today. The number of patterns analyzed per market is vast, and computers are required to process these extensive datasets. Predictive models are then built using only the most frequent and historically well-distributed patterns, enhancing the reliability and robustness of the forecasts.
In summary, QUANTCHARTS provide statistical forecasts derived from a large set of patterns that consistently recur in market history.
If you're wondering why these patterns are repetitive in history, the answer lies partly in behavioral finance and partly in the rising prevalence of algorithmic trading systems over the past 40 years. These systems trade constantly in a repetitive manner, using systematic rules, which generate detectable market behaviors that started in the past and continue to persist today.
Some behaviors may only appear during certain historical periods and may disappear after a few years, while others remain consistent over time (we call them eternals), making them reliable for predicting market reversals. A basic example is the behavior observed in oversold markets, which tend to bounce back and recover from excessive sell-offs, simply because investors and algorithms view lower, discounted prices as attractive.
Our quantitative research, however, does not focus on uncovering the reasons behind these behaviors (which are numerous and too complex to reverse engineer). Instead, we focus on observing their outcomes. QUANTCHARTS precisely display these possible outcomes (specifically, the potential market direction today) based on the analysis of past, historically documented, repetitive actions of market participants.
The 2 images above present an example of how to use a QUANTCHARTS reversal forecast to trade a Vertical Spread trade on NDX Options. Click on the images to expand them for better readability.
NDX is a CBOE Index for the Nasdaq 100 Index and offers one key advantage: the options are settled in cash at expiry, so you will never get assigned - this in turn reduces massively your margin requirements at expiry, if compared, for example, to NQ CME futures (futures require a much higher margin because you may get assigned the underlying future contracts, and your broker wants to fully cover that risk).
If you trade an ATM NDX Vertical Spread, your margin cost will be less than 600 USD per contract, the exact cost depends on the premium you bought/sold when you entered the trade. If you trade the same spread on the SPX ticker, the margin for an ATM Vertical Spread will be around 250 USD per contract, and if you the trade on the SPX Mini CBOE Index (XSP), the margin will be around 50 USD per contract.
This shows that cash-settled Vertical Spreads can be traded with minimal margin requirements, anyone can trade them. So, we suggest trading cash-settled options, whenever possible, to reduce your margin requirements and to increase your leverage.
NDX, SPX and XSP Vertical Spreads Options offer DAILY (1-day) expiries, they can be traded once a day, from one Close (enter the trade) to the next (settle the trade).
Vertical Spreads are the best instrument to trade with QUANTCHARTS, because they can be fully profitable as long as the market price does not reach the Verticals' Strike price.
This reduces the requirements for a forecast to be successful: you do not need to predict correctly a reversal on the next bar, it is sufficient to predict which Strike will not be reached on the next bar (expiry bar), to profit.
The following example assumes you are already somehow familiar with the inner workings of Vertical Spreads options.
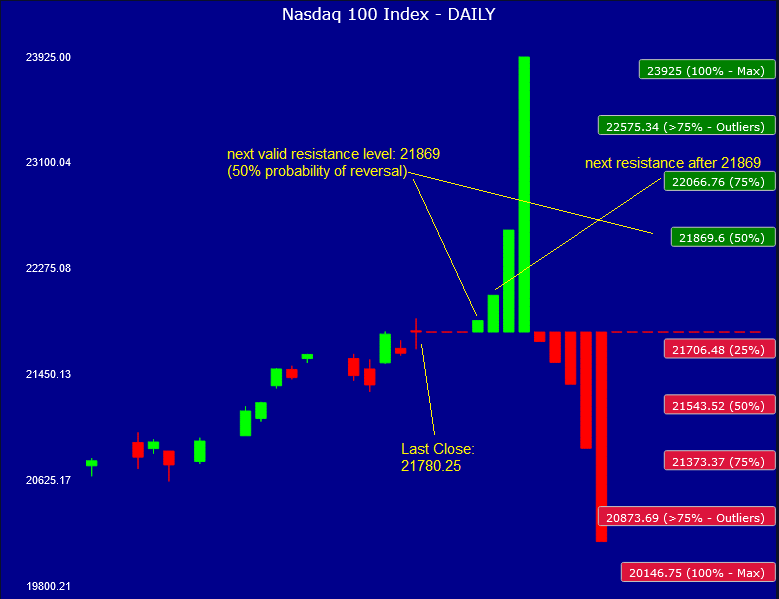
The image with the blue chart with the red/green candlesticks (above) shows that the NDX closed up for consecutive 2 days, and the last Close (21780) has almost reached the 21869 resistance level (50% probability of reversal for the next day, when this pattern is encountered).
So the odds are not yet fully in your favor (we want at least => 50% probability of reversal to enter a trade, unless it is a buy-the-dip trade, in that case a 25% probability is usually enough).
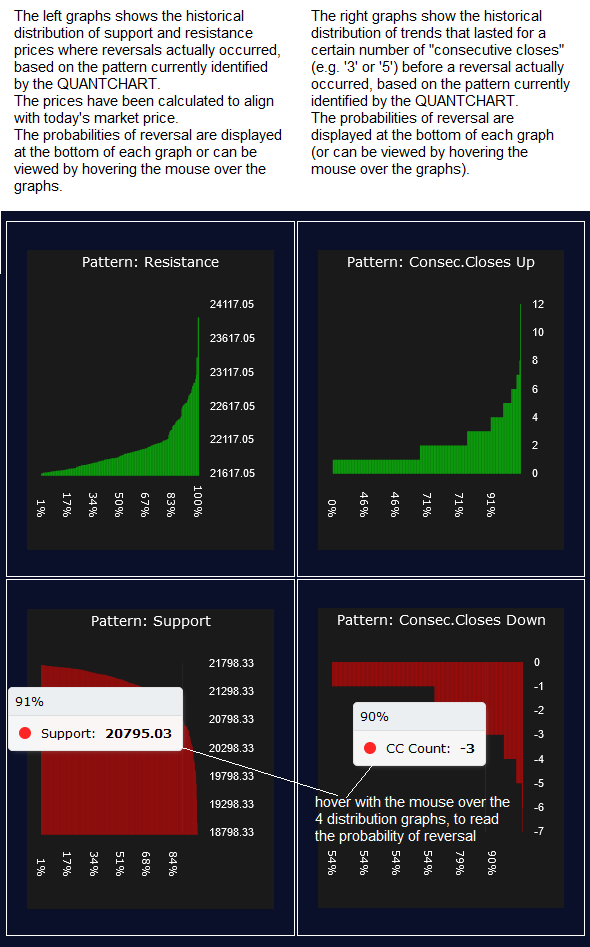
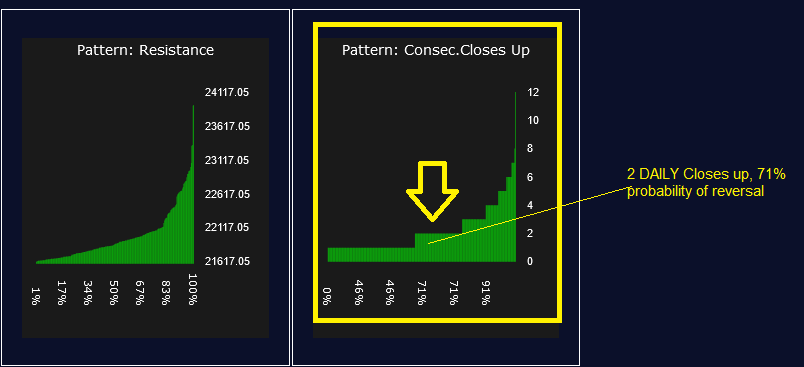
If you check the second image after the blue chart, the green graphs image, it shows the probability of reversal based on the number of consecutive DAILY bars closing up. You can see that after 2 days up the NDX 100 has a 71% probability to reverse, when this pattern is encountered.
Now what you have to do is to sum up the 50% probability from the blue chart (the PRICE-based probability) and the 71% probability from the TIME-based probability graph, and divide all by 2 to obtain the Total Probability.
Here is the formula:
Total Probability = (PRICE probability + TIME Probability) / 2
The result is: (50+71)/2= 60.5% probability of reversal (i.e. the next Close has a 60.5% probability to close down).
60% is not exceptionally favorable, but it is good enough to enter the trade (being >50% it satisfies our "better than a coin flip" minimum requirement/rule of thumb).
IMPORTANT: keep in mind that probability is only an indication, a possibility, it does not mean certainty, so there is always a risk involved when entering a trade, even if you have 90% probability in your favor (still a 10% risk that the trade will fail).
Once you have figured out the Total Probability for the trade, you can enter a Vertical Spread trade (a BearCALL, in this example) at a Strike = Close price (21780), and this would be an ATM Vertical Spread (certain Vertical Spreads offer nearly the same profit and loss when you trade ATM, and this plays in your favor).
Alternatively, you could place a Vertical Spread trade at a Strike price > 21780, and this would be an OTM Vertical Spread: your probability of success (i.e. the probability that the next Close will be below your selected Strike) will increase, but if the trade fails you will end up with a bigger loss (OTM Vertical Spreads profit/loss curves are skewed, the losses are bigger than the profits), so here there is a trade-off, and you have to decide what to do.
Please note that we do not and cannot offer any advice to manage your risk, you need to have your own risk management in place before entering any trade.
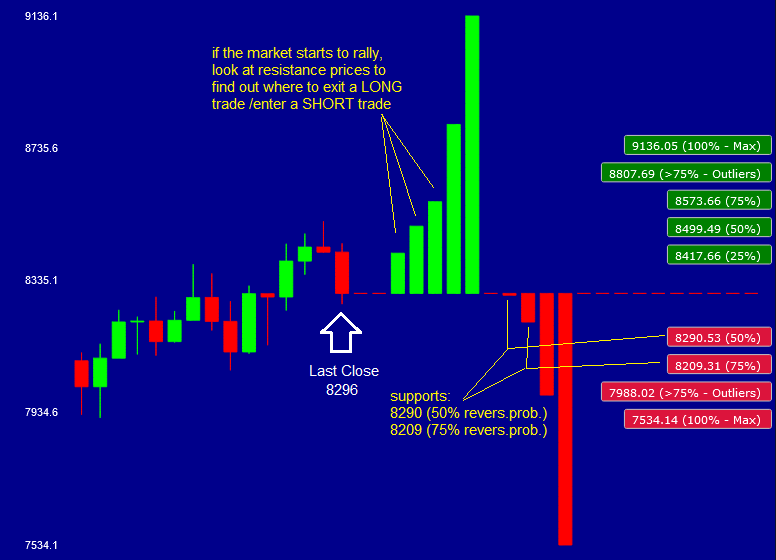
The QUANTCHART above displays a market that has been trending up quite steadily and currently has closed down for 2 consecutive bars. The last Close was 8296. This is a typical scenario where the QUANTCHARTS can be used to determine where to enter a directional trade, e.g. LONG, in this example.
The core idea behind this trade is: buy-the-dip during a rally, by entering at a point where both the PRICE and TIME models indicate a good probability of reversal.
A LONG reversal could lead to a continuation of the trend, and by entering at a discounted price you increase your profitability if compared to a standard buy&hold strategy.
The support levels (red bars and red labels, displayed on the right hand side of the chart), show clearly the probability of LONG reversal: for example the 8290 support (just below the last Close at 8296) has 50% probability of reversing up. Please note: a reversal can last a minimum of 1 bar (e.g. 1 day on DAILY models, and 1 week on WEEKLY models), and usually won't last more than 3 to 5 bars, on average, although this can vary from pattern to pattern.
The 8209 support has even greater probability of reversal, 75%, but we do not know if the market can go that low: you could sit and wait, in the hope of getting a chance to enter at that price with a higher probability of reversal, but you could also miss the chance to enter, if the market just rebounds and goes higher without ever reaching the 8209 support area.
The decision on when/where to enter the trade is entirely up to you: each trade is a bet, and we offer a model to evaluate the probability of that bet to be successful, but you'll have to take the bet by yourself - we cannot tell you if or when to enter a trade.
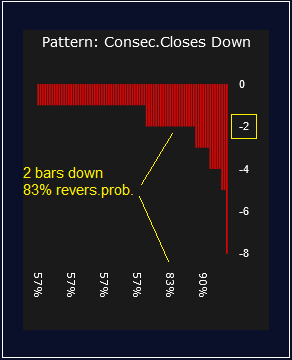
Before finalizing your decision, you need to evaluate the TIME model, the model that counts the number of consecutive closes for the current market direction (2 bars down, in this example).
The TIME model is displayed on the right side of the candlesticks QUANTCHART, it shows the probability of reversal after a number of closes in one direction, based on the average historical behavior of the current pattern.
In this example (see image below), the reversal probability of this pattern after 2 bars down, is 83%, quite high. To predict how far the market can go after the reversal, you will need to look at the green bars (resistance) displayed on the candlesticks QUANTCHART at the top of this text.
Now let's calculate the total probability of LONG reversal in the 8290 price area, after 2 negative closes:
(50%+83%)/2 = 66.5%
The probability for this trade is 66.5%, not exceptional but better than 50% (better than a coin flip), so this is a valid setup, for a LONG trade.
One last thing you need to consider before finalizing your trade decision is how the 2 probabilities models (PRICE AND TIME) relate to the trade, when considered separately: for example the TIME model is clearly OVERSOLD at 83% probability (i.e. high chance of reversal after 2 bars down), but the PRICE model has only 50% probability at the 8290 support level.
Since this is a buy-the-dip trade, we are assuming that the market usually dips briefly and not deeply, when it is uptrending, and then reverses quickly and go higher. Based on these considerations, you can enter the trade at support prices with lower probability of reversals, between 25% and 50%, so in this case the 50% probaility of LONG reversal at 8290 is more than enough.
In conclusion, the probability for a trade should be evaluated from case to case, weighting the influence of the TIME and PRICE model in the context of the current scenario and pattern.
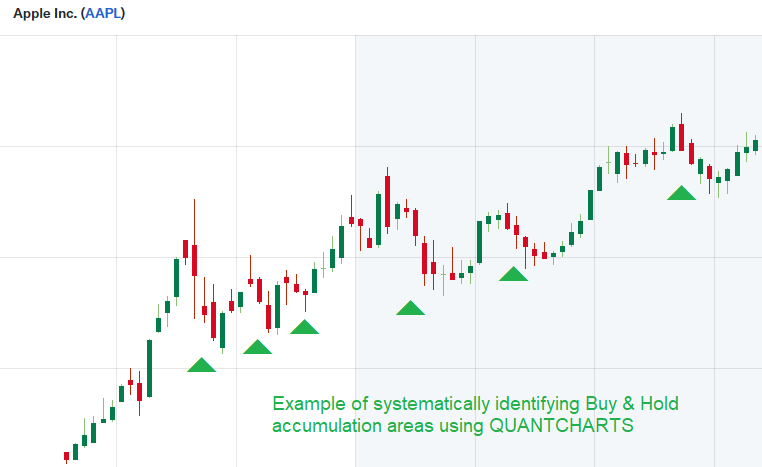
If you are a long-term buy-and-hold investor, QUANTCHARTS can help you identify key support areas where it is advantageous to add to your holdings at more attractive prices.
For example, suppose you hold Apple Inc. (AAPL) in your portfolio and plan to keep it long-term (2–5 years or more). When AAPL experiences a price pullback, it presents an opportunity to increase your position at a discount.
QUANTCHARTS provides the statistical probability of a price reversal at WEEKLY support levels. For instance, it might indicate a 50% probability of reversal for AAPL at $126.
This probability is calculated using both price pattern and time pattern models combined together.
By understanding the probability of a reversal at specific support prices and times, you can make informed decisions about whether the stock is likely to resume its uptrend from the current level.
This quantitative, probabilistic approach allows you to strategically add long positions to your portfolio, potentially enhancing your returns over time in a more systematic and disciplined manner compared to adding positions at random.
Note: the method outlined in this example is not intended to predict the market’s long-term trend direction. Instead, it aims to identify short-term inflection points—areas where prices are temporarily discounted relative to recent levels—offering potentially favorable entry points before the broader uptrend resumes.
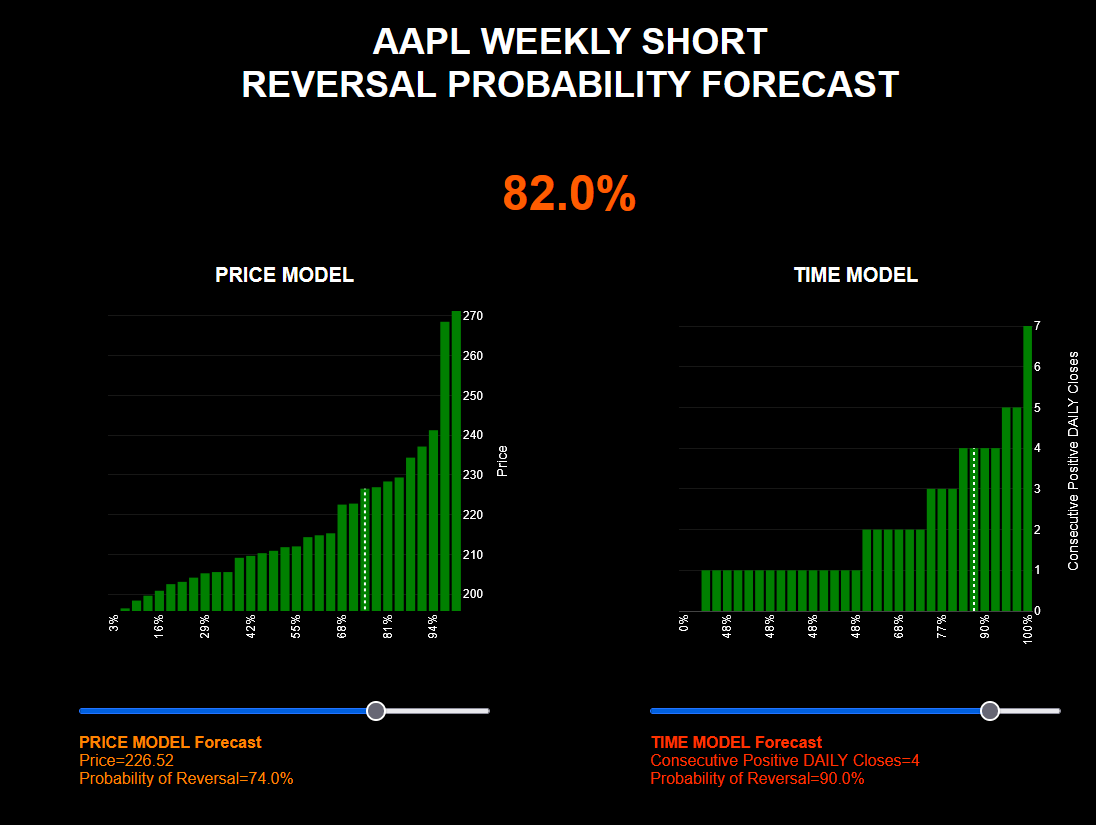
The FORECASTS are the same Price and Time Models used in the QUANTCHARTS, now available in an interactive format. Users can adjust the sliders beneath the models to simulate different scenarios and calculate the probability of a price reversal—based on both the projected price level and the number of consecutive closes in one direction.
Example:
Suppose you're considering buying a put option to short or hedge Apple Inc. (AAPL). You can model a scenario in which AAPL has rallied for four consecutive weeks and hits a specific target price, then assess the likelihood of a reversal from that point.
By setting the models to reflect this scenario, the tool will return the combined price-time probability of reversal. Note that this probability is pattern-specific—it dynamically adjusts based on the current pattern identified by the model, rather than applying a generic assumption.
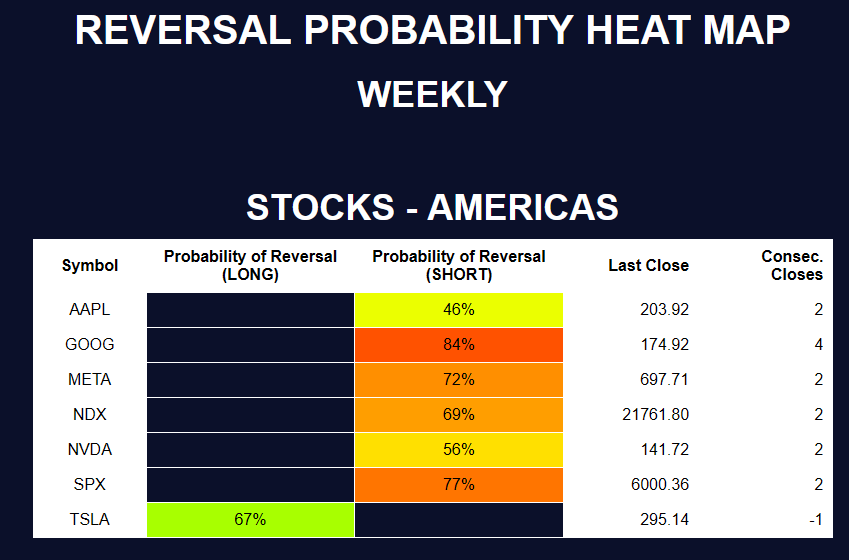
The HEAT MAPS provide a synoptic view of the probability of reversal across all covered markets, both DAILY and WEEKLY.
They also display the most recent DAILY or WEEKLY Close and the count of Consecutive Closes, allowing the user to quickly assess the status of each market symbol and use that information to update the FORECAST tools or to see at a glance which market symbols have a high probability of trend reversal.